Broad, Growing Support for Same-Sex Marriage
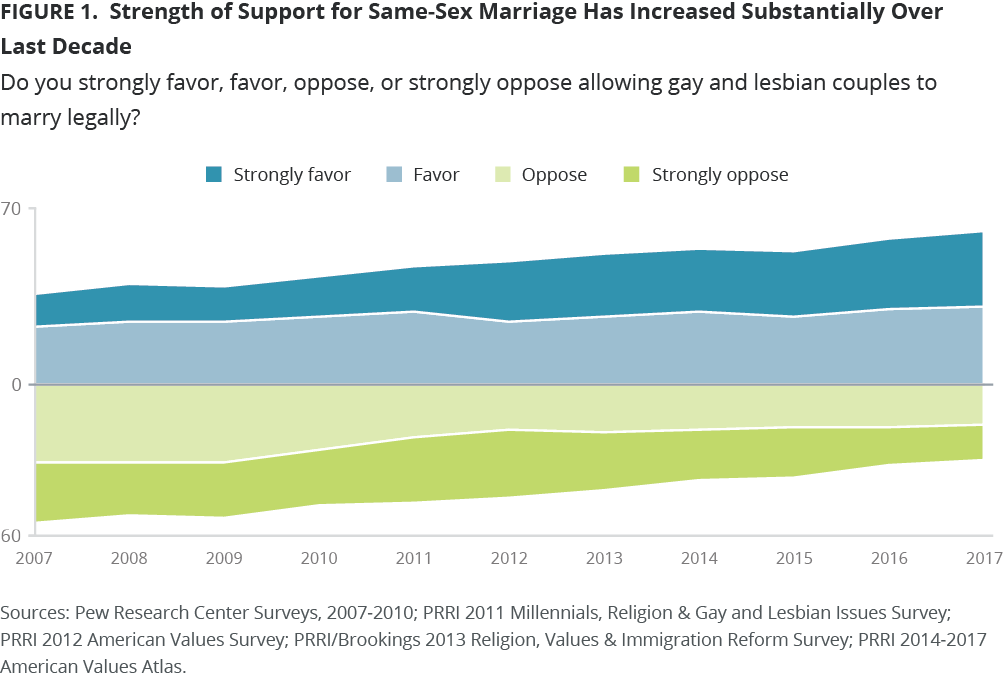
Since the U.S. Supreme Court ruled in 2015 that same sex couples have a constitutional right to marry, support for same-sex marriage has increased substantially. Currently, more than six in ten (61%) Americans say gay and lesbian couples should be able to marry legally, while only about half as many (30%) are opposed.
Strength of support for same-sex marriage has increased dramatically over the past decade, while strength of opposition has fallen in nearly equal measure. Today, Americans who strongly favor same-sex marriage outnumber those who strongly oppose it by more than a two-to-one margin (30% vs. 14%). In 2007, only 13% of the public strongly favored same-sex marriage, while nearly one-quarter (24%) strongly opposed it.1 Much of this shift has occurred within the last five years. As recently as 2013, more than four in ten (42%) Americans opposed same-sex marriage, including about one in four (23%) who strongly opposed it.2 Over the last five years, strong supporters of same-sex marriage increased only modestly, from 25% to 30%.
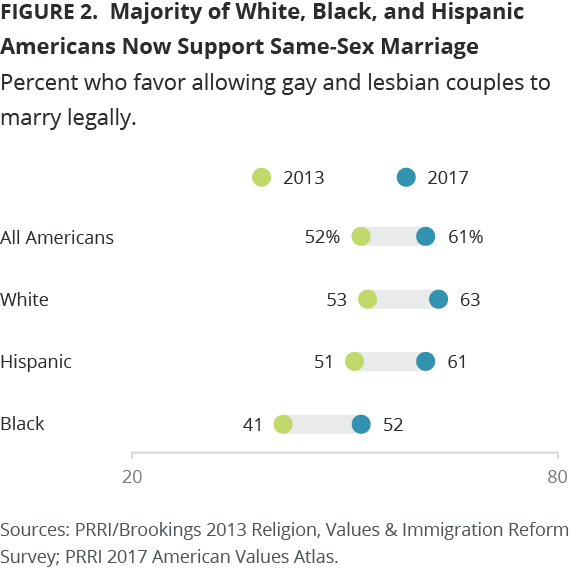
The rise in support for same-sex marriage, particularly over the last few years, has led to a milestone: Today a majority of all racial and ethnic groups favor allowing gay and lesbian couples to marry legally. Between 2013 and 2017, we have seen a double-digit increase in support for same-sex marriage among white (53% vs. 63%), black (41% vs. 52%), and Hispanic (51% vs. 61%) Americans.3 Currently, about four in ten (39%) black Americans, three in ten (30%) white Americans, and only about one-quarter (26%) of Hispanic Americans oppose same-sex marriage. Majorities of smaller racial and ethnic groups also support same-sex marriage today, including Asian-Pacific Islander Americans (72 percent), Native Americans (56 percent), and those identifying as multiracial or with another racial and ethnic group (66 percent).
Conservative Republican Holdouts
Partisan gaps in views of same-sex marriage persist, even as the public has become more supportive of the policy overall. Nearly three-quarters (73%) of Democrats and about two-thirds (66%) of independents favor same-sex marriage, compared to only 42% of Republicans. A slim majority (51%) of Republicans oppose same-sex marriage. However, opposition is mostly confined to conservative Republicans. Nearly six in ten liberal (58%) and moderate (59%) Republicans favor same-sex marriage, compared to only 36% of conservative Republicans. About six in ten (58%) conservative Republicans oppose it.
Among Democrats, as well, there is a considerable ideological divide. Nearly nine in ten (87%) liberal Democrats say same-sex marriage should be legal, compared to 67% of moderate and 52% of conservative Democrats. Four in ten (40%) conservative Democrats oppose same-sex marriage.
Liberal independents are roughly as supportive of same-sex marriage as liberal Democrats. More than eight in ten (82%) liberal independents favor same-sex marriage, compared to nearly three-quarters (73%) of moderate independents and fewer than half (49%) of conservative independents. More than four in ten (41%) conservative independents oppose allowing gay and lesbian couples to marry.
Declining Religious Resistance
Most religious groups in the U.S. now support same-sex marriage, including overwhelming majorities of Unitarians (97%), Buddhists (80%), the religiously unaffiliated (80%), Jewish Americans (77%), and Hindus (75%). Roughly two-thirds of white mainline Protestants (67%), white Catholics (66%), Orthodox Christians (66%), and Hispanic Catholics (65%) also favor same-sex marriage. A slim majority of Muslims (51%) favor same-sex marriage, but only 34% are opposed; 15% offer no opinion on this issue.
Over the last five years, opposition to same-sex marriage among nonwhite Protestants has dropped considerably. Most notably, black Protestants have moved from solid opposition to a plurality of support for same-sex marriage. In 2013, nearly six in ten (57%) black Protestants opposed same-sex marriage.4 Today just 43% oppose it, compared to nearly half (48%) who support it. Hispanic Protestants have moved from solid opposition to same-sex marriage to being divided over the policy. In 2013, nearly two-thirds (65%) of Hispanic Protestants opposed same-sex marriage. Today, 43% favor the policy, compared to 45% who oppose it and 13% who offer no opinion.
Opposition to same-sex marriage is now confined to a few of the most conservative Christian religious traditions. Only about one-third (34%) of white evangelical Protestants support same-sex marriage today, while nearly six in ten (58%) are opposed, including 30% who are strongly opposed. And just 40% of Mormons support same-sex marriage, compared to 53% who are opposed. Jehovah’s Witnesses, a racially mixed religious group, are the exception. Just 13% support the policy, compared to 63% who oppose it. However, nearly one-quarter (24%) of Jehovah’s Witnesses express no opinion on this issue.
Nevertheless, even those religious groups most opposed to same-sex marriage have become more accepting of it over the last five years. Since 2013, opposition to same-sex marriage has dropped 13 percentage points among white evangelical Protestants (from 71% in 2013 to 58% today).5 Over a similar time period, opposition among Mormons has dropped 15 percentage points (from 68% in 2014 to 53% today).6
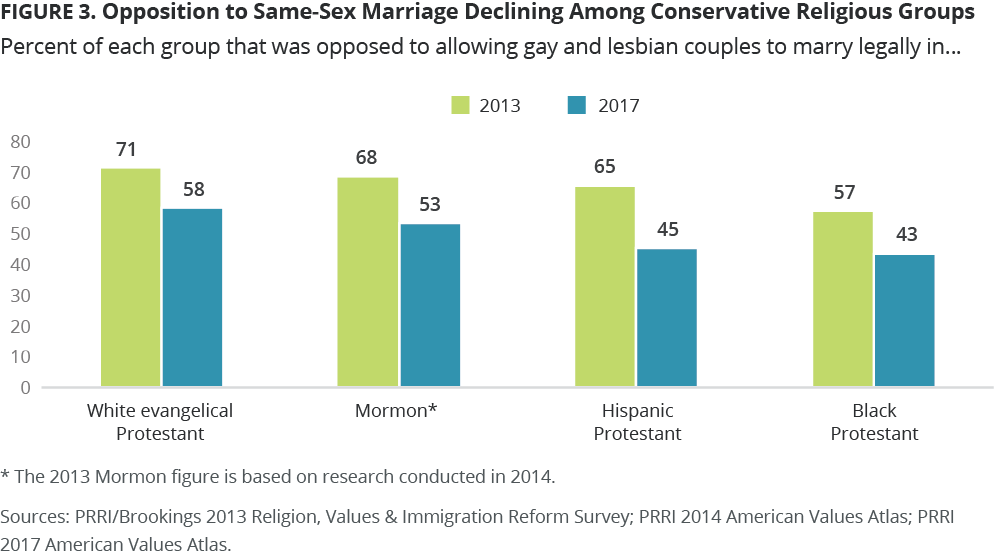
Opposition to Same-Sex Marriage Declining Among Conservative Religious Groups
The Coming Generational Realignment
The issue of same-sex marriage is approaching consensus among young adults (age 18 to 29). More than three-quarters (77%) favor legalizing same-sex marriage, including nearly half (45%) who strongly favor it. Only 17% of young adults are opposed. In contrast, fewer than half (47%) of seniors (age 65 and up) say same-sex marriage should be legal, while about four in ten (42%) oppose it. Ten percent of seniors express no opinion on the issue. Notably, there is an increase in support at both ends of the generational spectrum, although more movement occurred among older Americans. Support for same-sex marriage among young adults is up five percentage points from 72% in 2013, and support among seniors is up 11 percentage points from just 36% in 2013.7
The generational divide cuts through every demographic group in the U.S. Even in groups most opposed to same-sex marriage, a majority of young adults favor this policy. A majority (53%) of young white evangelical Protestants favor legalizing same-sex marriage, compared to just one-quarter (25%) of white evangelical seniors. A majority (52%) of young Mormons also believe same-sex marriage should be legal, while only about one-third (32%) of Mormon seniors agree.8 While only 37% of black Protestant seniors favor same-sex marriage, nearly two-thirds (65%) of young black Protestants support it.
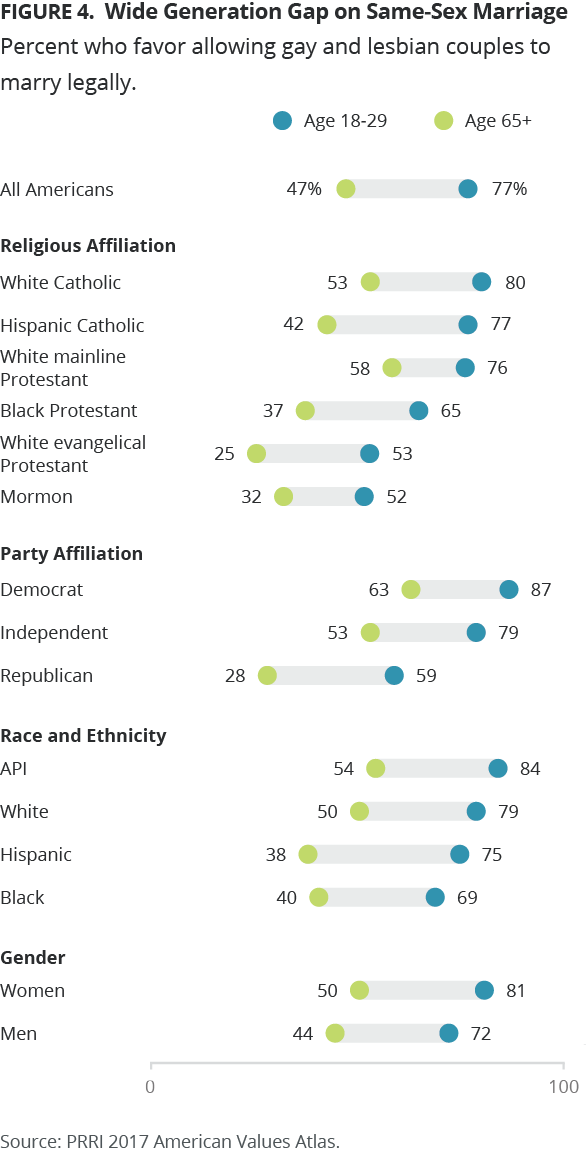
Wide Generation Gap on Same-Sex Marriage
The generation gap is larger among Republicans than Democrats. Young Republicans are more than twice as likely as senior Republicans to favor same-sex marriage (59% vs. 28%). In contrast, Democratic young adults and seniors largely agree on same-sex marriage (87% and 63% support it, respectively).
Among no racial or ethnic group is the generation gap wider than Hispanic Americans. Three-quarters (75%) of young Hispanics favor same-sex marriage, compared to only 38% of Hispanic seniors, a gap of 37 percentage points. Among white Americans, roughly eight in ten (79%) young adults favor same-sex marriage, compared to half (50%) of white seniors. And close to seven in ten (69%) young black Americans express support for same-sex marriage, compared to only 40% of black seniors. Finally, majorities of both young (84%) and senior (54%) Asian-Pacific Islander Americans favor same-sex marriage.
Enduring Gender Divides
More women than men in the U.S. support allowing same-sex couples to marry. Roughly two-thirds (65%) of women overall favor same-sex marriage, compared to fewer than six in ten (58%) men. The gender gap crosses lines of race and ethnicity, although its size varies substantially from group to group. Two-thirds (67%) of white women and fewer than six in ten (59%) white men favor same-sex marriage. Among Hispanic Americans, 64% of women favor it, compared to 57% of Hispanic men. And though support is much higher overall among API Americans than other ethnic groups, API women still express greater support than men (76% vs. 67%). Black Americans stand out here in not displaying a gender gap: Similar numbers of black women (53%) and men (50%) favor same-sex marriage.
Notably, the gender gap is slightly larger among young adults than older Americans. More than eight in ten (81%) young women favor same-sex marriage, compared to 72% of young men. The intensity gap is even larger among young people, with 52% of young women expressing strong support for same-sex marriage, compared to 38% of young men. Among seniors, the gender gap and intensity gap are somewhat more modest. Senior women are more likely to favor same-sex marriage than senior men (50% vs. 44%).
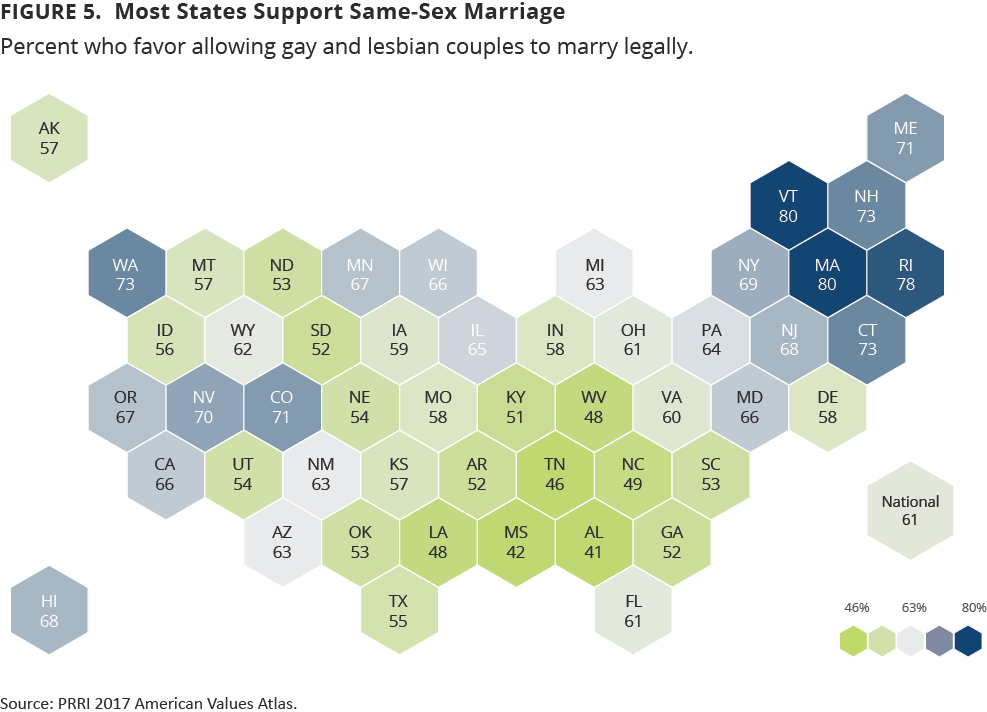
Most States Now Support Same-Sex Marriage
Recent dramatic shifts in support for same-sex marriage are also evident at the state level. Today, majorities in 44 states believe gay and lesbian couples should be allowed to legally marry, compared to only 30 states in 2014.9 In only six states does the issue of same-sex marriage garner less than majority support: Alabama (41%), Mississippi (42%), Tennessee (46%), West Virginia (48%), Louisiana (48%), and North Carolina (49%). But notably, only one state, Alabama, has a majority of residents who oppose same-sex marriage.
Substantial regional disparities in views of same-sex marriage are evident. New England is generally more supportive of same-sex marriage than any other region in the U.S. Roughly eight in ten residents of Vermont (80%), Massachusetts (80%), and Rhode Island (78%) support the policy. And nearly three-quarters of Americans living in Connecticut (73%), New Hampshire (73%), and Maine (71%) support it. A number of Southern states have only a slim majority expressing support for same-sex marriage, such as Kentucky (51%), Arkansas (52%), and Georgia (52%).
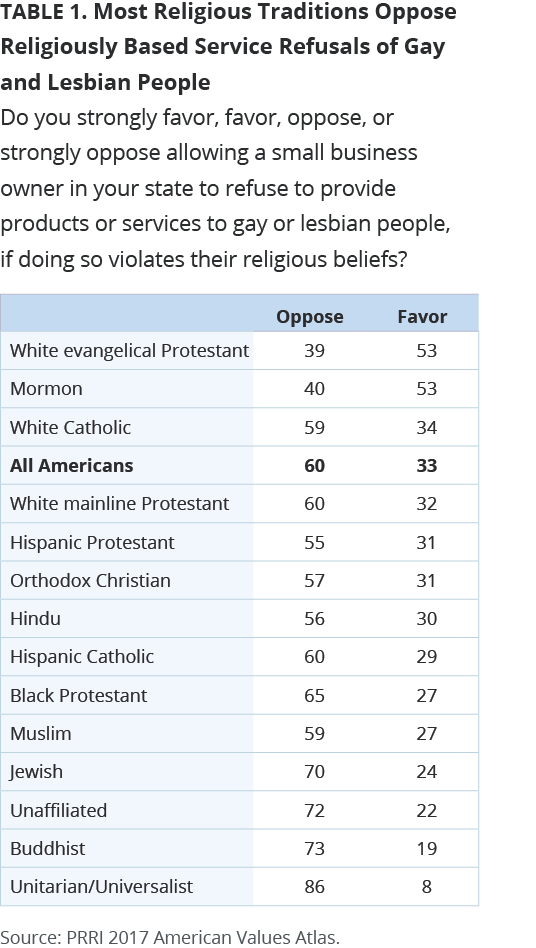
Religiously Based Service Refusals Remain Unpopular
Religiously based refusals of service to gay and lesbian people are relatively unpopular among the American public. Six in ten (60%) Americans oppose allowing a small business owner in their state to refuse products or services to gay or lesbian people if providing them would violate their religious beliefs. One in three (33%) Americans support such a policy. Eight percent offer no opinion. Attitudes have remained stable since 2015, when 59% of Americans opposed allowing business owners to refuse products or services to gay and lesbian people for religious reasons.10
Black Americans are more likely than any other racial or ethnic group to oppose religiously based service refusals. Nearly two-thirds (66%) of black Americans oppose them, compared to roughly six in ten Hispanic (61%), Asian-Pacific Islander (60%), and white (58%) Americans.
Women are more likely than men to oppose religiously based service refusals. Close to two-thirds (64%) of women oppose allowing small businesses to refuse to provide products or services to gay or lesbian people, compared to 55% of men. But the gender gap varies somewhat across racial and ethnic groups. It is most pronounced among white Americans: White women are far more likely to oppose them than white men (64% vs. 52%). Differences between black women and men (68% vs. 64% are opposed) and API women and men (58% vs. 61% are opposed) are much narrower. Hispanic women and men demonstrate a slightly wider gap than other nonwhite Americans, but still not as large a gap as that of white people: Sixty-four percent of Hispanic women oppose religiously based service refusals, compared to 58% of Hispanic men.
Only Mormons and White Evangelicals Support Religiously Based Service Refusals
Most religious groups do not believe small business owners should be allowed to refuse service to gay and lesbian people for religious reasons. Nearly nine in ten (86%) Unitarians and at least seven in ten Buddhists (73%), unaffiliated Americans (72%), and Jewish Americans (70%) oppose such a policy. And roughly two-thirds (65%) of black Protestants and about six in ten white mainline Protestants (60%), Hispanic Catholics (60%), white Catholics (59%), and Muslims (59%) also reject a policy allowing religiously based refusals to serve gay and lesbian people. Majorities of Orthodox Christians (57%), Hindus (56%), and Hispanic Protestants (55%) are also opposed to the policy.
Only two major religious groups believe small business owners in their state should be allowed to refuse service to gay or lesbian people on religious grounds—white evangelical Protestants and Mormons. Notably, they support this position at the same rate—53%.
Although there are profound generational differences among white evangelical Protestants regarding same-sex marriage, on the issue of service refusals the generation gap is minimal. Roughly half (49%) of white evangelical seniors and half (50%) of young adults would allow small business owners to refuse service based on their religious beliefs, while 40% of seniors and 45% of young adults would not.
Sharp Political Divisions
As with same-sex marriage, views on religiously based service refusals vary dramatically by political affiliation. More than three-quarters (76%) of Democrats and six in ten (60%) independents are opposed, compared to only 40% of Republicans. A slim majority (52%) of Republicans favor giving business owners in their state the right to refuse products or services to gay or lesbian people if providing them would violate their religious beliefs.
Among Republicans there are stark divisions by ideology. Nearly six in ten (59%) conservative Republicans say religiously based service refusals should be legal, compared to roughly four in ten (39%) moderate and about three in ten (31%) liberal Republicans. But a majority of moderate (55%) and liberal (63%) Republicans oppose such a policy.
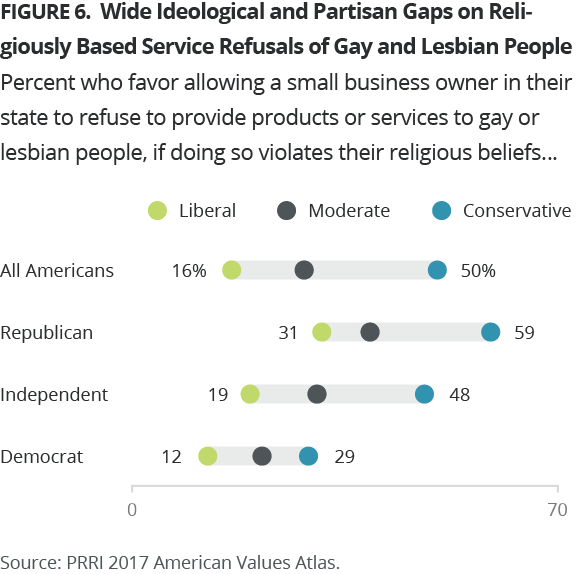
There are also sharp ideological differences among independents. Conservative independents are roughly divided, with about as many supporting the right to religiously based service refusals as opposing (48% vs. 44%) it. In contrast, 63% of moderate independents and more than three-quarters (77%) of liberal independents do not think small business owners have this right.
Democrats are far more unified than Republicans and independents in their position on the matter. Majorities of liberal (85%), moderate (72%), and conservative (63%) Democrats oppose religiously based refusals to serve gay and lesbian people.
More Modest Generational Divisions
Although views on same-sex marriage are highly stratified by age, on the issue of service refusals there is greater consensus across age cohorts. A majority of Americans across generations oppose them. Two-thirds of young adults (67%) and a majority of seniors (53%) say small businesses should not be allowed to refuse to serve gay or lesbian people, even if doing so violates their religious beliefs. Only 36% of seniors say this should be allowed, while 11% express no opinion.
The Relationship Between Support for Same-Sex Marriage and Service Refusals
Even among Americans who oppose same-sex marriage, close to half (45%) are against allowing small business owners to refuse service to gay and lesbian people. A similar number (48%) would allow them this option if providing service violates their religious beliefs.
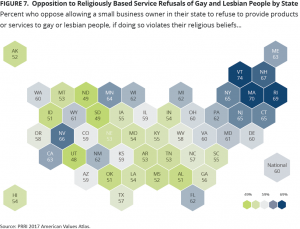
Opposition Across the Country
A majority of Americans in nearly every state believe small business owners in their state should not be allowed to refuse service to gay and lesbian people. Notably, state-level opposition to same-sex marriage or nondiscrimination protections for LGBT people does not reliably predict state-level support for religiously based service refusals. Whereas opposition to same-sex marriage and nondiscrimination protections is concentrated in the South, the states with the lowest levels of opposition to service refusals cluster in and near the Mountain West and Midwest. In three states—Utah (48%), North Dakota (49%), and South Dakota (49%)—fewer than half of residents oppose service refusals. A slim majority of residents of Idaho (51%), Oklahoma (51%), Nebraska (53%), and Montana (53%) object to them.
In contrast, New England states express the strongest objection to religiously based service refusals. At least two-thirds of residents of Vermont (74%), Massachusetts (70%), Rhode Island (69%), and New Hampshire (67%) oppose allowing small business owners to refuse gay and lesbian customers.
Americans Continue to Support Nondiscrimination Protections for LGBT People
Americans are broadly supportive of laws that would protect lesbian, gay, bisexual, and transgender (LGBT) people against discrimination in jobs, public accommodations, and housing. Seven in ten (70%) Americans favor such laws, including more than one-third (35%) who strongly favor them. Fewer than one-quarter (23%) of Americans oppose legal nondiscrimination protections for LGBT Americans.
Although there is broad agreement about nondiscrimination laws, there are still notable differences by age and gender. Younger Americans tend to be more supportive of legal protections than older Americans. Nearly eight in ten (78%) young adults (age 18-29) favor nondiscrimination protections, including 45% who strongly favor them. Even among seniors (age 65 and up), who tend to be less supportive of same-sex marriage, more than six in ten (61%) favor nondiscrimination protections for LGBT Americans, and only 29% oppose them.
Gender differences on this issue are much more modest than with respect to same-sex marriage. Nearly three-quarters (73%) of women favor the passage of laws that would protect LGBT Americans from discrimination in jobs, public accommodations, and housing, compared to about two-thirds (65%) of men. But there is a considerable intensity gap: Four in ten (40%) women, compared to only about three in ten (29%) men, strongly favor nondiscrimination protections for LGBT people.
Americans, Regardless of Race and Ethnicity, Support Nondiscrimination Protections
There is only modest variation across racial and ethnic lines in support for nondiscrimination laws to protect LGBT Americans. About two-thirds (66%) of black Americans favor these protections, as do about seven in ten Hispanic (69%) and white (71%) Americans. Asian-Pacific Islander Americans demonstrate the highest levels of support, with 75% favoring nondiscrimination laws to protect LGBT Americans.
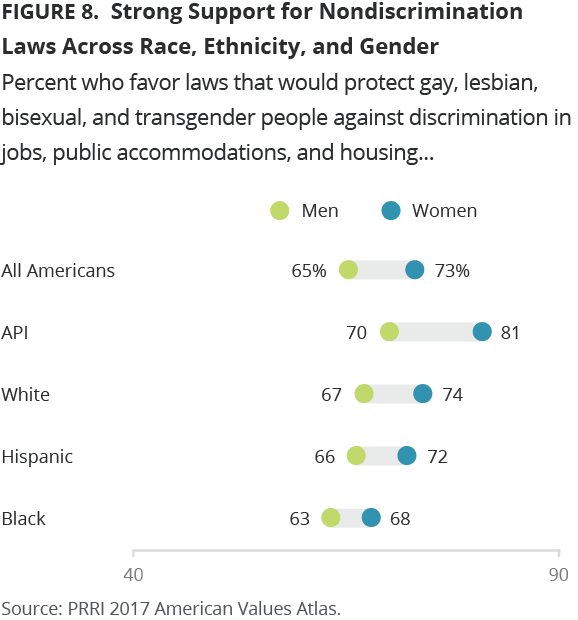
The gender gap is fairly constant across racial and ethnic groups, but there is considerable variation in its size. Black men express the lowest level of support for nondiscrimination policies aimed at protecting LGBT people, while API women express the greatest. More than six in ten (63%) black men favor nondiscrimination laws, compared to 66% of Hispanic, 67% of white, and 70% of API men. More than two-thirds (68%) of black women favor these policies, while more than seven in ten Hispanic (72%), white (74%), and API (81%) women say the same.
Support for Nondiscrimination Protections Transcends Partisan Boundaries
Nondiscrimination protections for LGBT people are broadly supported across party lines, although Democrats and independents register greater support for them. More than seven in ten independents (72%) and Democrats (79%) favor providing legal protections from discrimination for LGBT people, while nearly six in ten (58%) Republicans say the same. Notably, half (50%) of Democrats strongly favor these protections.
While political ideology also influences views on nondiscrimination protections for LGBT people, it plays a larger role in structuring the attitudes of independents and Democrats than Republicans. Six in ten (60%) conservative independents favor laws to protect LGBT individuals against discrimination in jobs, public accommodations, and housing, compared to about eight in ten moderate (77%) and liberal (82%) independents. Democrats demonstrate a similar pattern. While less than two-thirds (63%) of conservative Democrats support nondiscrimination protections, more than three-quarters (76%) of moderate and nearly nine in ten (87%) liberal Democrats say the same.
There are more modest ideological differences among Republicans. Roughly two-thirds of moderate (68%) and liberal (65%) Republicans support nondiscrimination protections for LGBT people, compared to 56% of conservative Republicans.
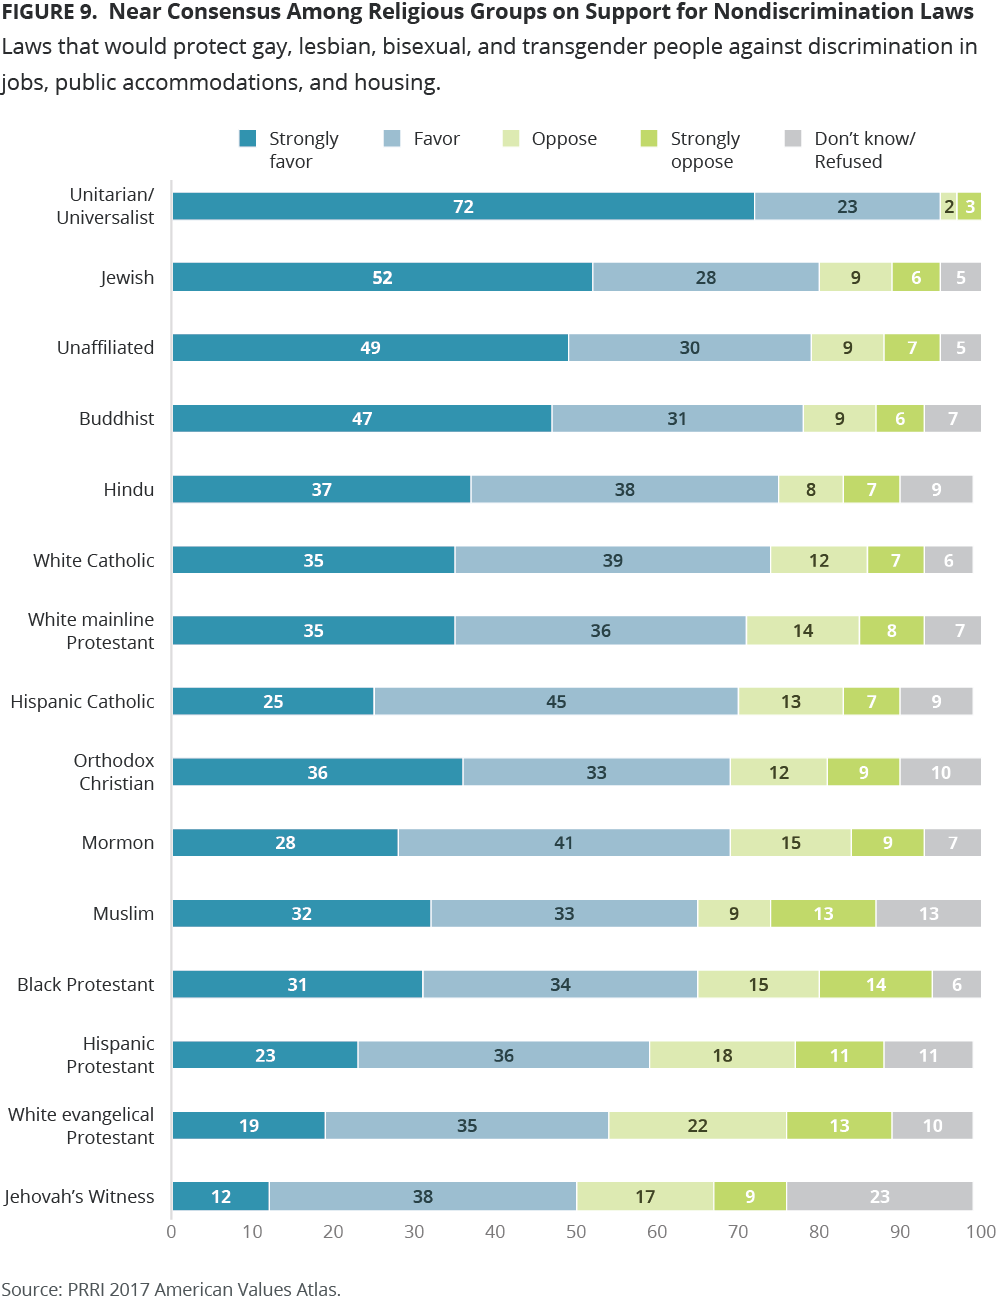
Near Consensus Among Religious Groups on Nondiscrimination Policies
Majorities of nearly every major religious group support legal protections against discrimination for LGBT Americans, with non-Christian religious groups tending to be the most supportive. No religious group is more supportive than Unitarians, among whom 95% favor nondiscrimination policies. At least three-quarters of Jews (80%), religiously unaffiliated Americans (79%), Buddhists (78%), and Hindus (75%) favor laws that protect LGBT Americans against discrimination in employment, housing, and public accommodations.
Support is also robust among most Christian religious communities. At least seven in ten white Catholics (74%), white mainline Protestants (71%), and Hispanic Catholics (70%) support nondiscrimination protections for LGBT people. Approximately two-thirds of Orthodox Christians (69%), Mormons (69%), and black Protestants (65%) favor them, as well as a majority of Hispanic Protestants (59%) and white evangelical Protestants (54%). While only half (50%) of Jehovah’s Witnesses support nondiscrimination protections, just over one-quarter (26%) oppose these protections, and roughly as many (23%) express no opinion.
Mormon Exceptionalism
Mormons are unique among religious Americans in their outlook on same-sex marriage and nondiscrimination protections for lesbian, gay, bisexual, and transgender people. Only 40% of Mormons favor allowing same-sex couples to marry, yet nearly seven in ten (69%) support laws that would protect LGBT people from discrimination in housing, public accommodations, and employment—a 29-point gap. Among no other major religious group is the gap on these two issues larger.
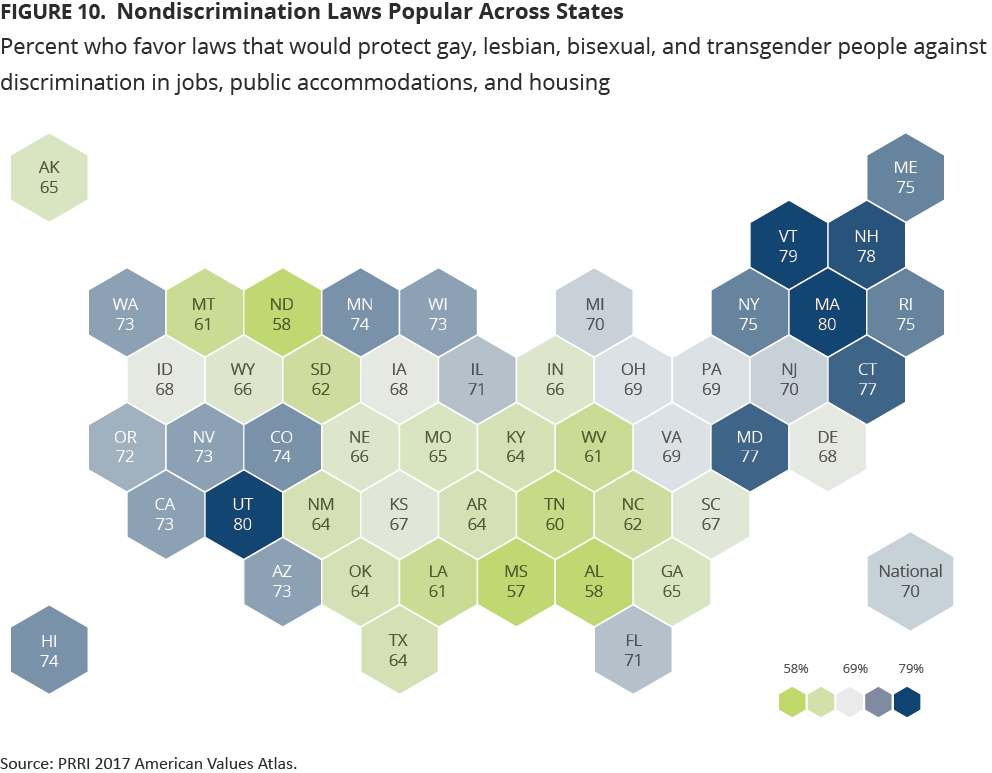
Majorities of Residents of Every State Favor Nondiscrimination Protections for LGBT People
Majorities of residents of every state favor nondiscrimination protections for LGBT Americans. Predictably, New England states express the most robust support for laws designed to protect LGBT people from discrimination. At least three-quarters of the residents of Massachusetts (80%), Vermont (79%), New Hampshire (78%), Connecticut (77%), Maine (75%), and Rhode Island (75%) favor nondiscrimination protections for LGBT Americans.
Conversely, states with the lowest levels of support are primarily located in the South, as only about six in ten residents of Mississippi (57%), Alabama (58%), Tennessee (60%), Louisiana (61%), and West Virginia (61%) say LGBT people should be legally protected from discrimination.
States in the West tend to demonstrate high levels of support for nondiscrimination protections for LGBT individuals. More than seven in ten residents of the Western U.S.—including Washington (73%), California (73%), Nevada (73%), Arizona (73%), and Oregon (72%)—favor laws that would protect LGBT Americans from discrimination. Notably, despite the fact that only 54% of Utahans favor same-sex marriage, fully 80% say they would support laws to protect LGBT people from discrimination.
Survey Methodology
The 2017 American Values Atlas (AVA) is a project of PRRI. Results for questions on specific issues (e.g. LGBT issues) are based on a subset of 40,017 telephone interviews (including 23,903 cell phone interviews) conducted between April 5, 2017 and December 23, 2017 by professional interviewers under the direction of SSRS. The AVA was made possible by generous grants from the Evelyn and Walter Haas, Jr. Fund, the Gill Foundation, the Nathan Cummings Foundation, and the Unitarian Universalist Veatch Program at Shelter Rock.
Throughout 2017, at least 1,000 interviews were completed each week, with about 600 interviews conducted among respondents on their cell phones. Each week, interviewing occurred over a five-day period, from Wednesday through Sunday or from Thursday through Monday. The selection of respondents within households was accomplished by randomly requesting to speak with the youngest adult male or female currently living in the household.
Data collection was based on stratified, single-stage, random-digit dialing (RDD) of landline telephone households and randomly generated cell phone numbers. The sample was designed to represent the total U.S. adult population from all 50 states, including Hawaii and Alaska. The landline and cell phone samples were provided by Marketing Systems Group.
The weighting was accomplished in two separate stages. The first stage of weighting corrects for different probabilities of selection associated with the number of adults in each household and each respondent’s telephone usage patterns. In the second stage, sample demographics were balanced to match target population parameters for gender, age, education, race and Hispanic ethnicity, region (U.S. Census definitions), population density, and telephone usage. The population density parameter was derived from 2010 Census data. The telephone usage parameter came from an analysis of the January-June 2017 National Health Interview Survey. All other weighting parameters were derived from an analysis of the U.S. Census Bureau’s March 2017 Current Population Survey.
The sample weighting was accomplished using iterative proportional fitting (IFP), a process that simultaneously balances the distributions of all variables. Weights are trimmed so that they do not exceed 4.0 or fall below 0.25 to prevent individual interviews from having too much influence on the final results. The use of these weights in statistical analysis ensures that the demographic characteristics of the sample closely approximate the demographic characteristics of the target populations.
The margin of error for the sample is +/- 1.2 percentage points at the 95% level of confidence. The design effect is 1.4. Table 1 shows the margin of error and design effect for each weekly survey at the 95% level of confidence. Tables 2 and 3 show the sample sizes for each state and metro area. In addition to sampling error, surveys may also be subject to error or bias due to question wording, context, and order effects.